Now, I don’t trust the M2 model. I don’t care what you are thinking about me. You can agree or disagree with me. But let me tell you why I think so.
It was October 2025. Bitcoin had hit $126,000. Every analyst on Twitter (X) was posting the same chart: global M2 money supply rising, Bitcoin following like a loyal dog. The message was simple: print money, Bitcoin goes up. And, yes, it had worked for years.
Then, the printers kept running. And Bitcoin stopped following.
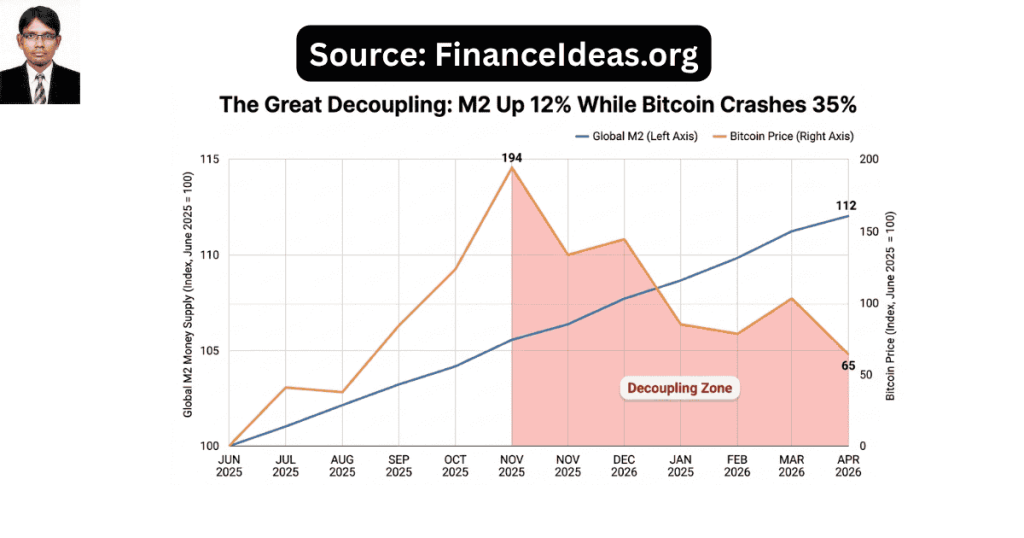
If I talk about today, Bitcoin is trading at $75,040.35. And, global M2 money supply? It hit a record $22.67 trillion in February 2026. That is a 12% increase since mid-2025. Bitcoin dropped 35% over the same period. Have you noticed it?
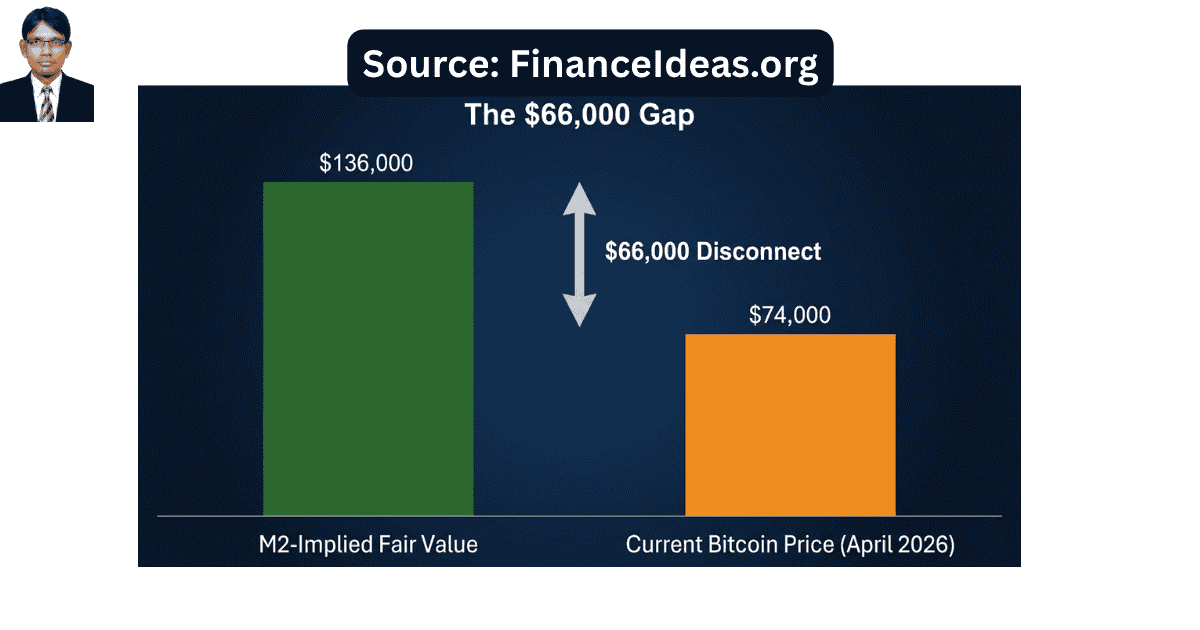
The gap between what the old model predicted and what happened is now $66,000 per Bitcoin.
This isn’t a small blip. This is the Great Decoupling according to me. And if you are still using the old M2 Roadmap, mark my word, “you are going to lose money in 2026.”
Look, I am not against other experts; they are more prominent than I am. I just explained my logic & trust me, it is reality & hard to neglect.
Related Articles
Finance ideas AI snippet box | Tapos Kumar
Why is Bitcoin down if M2 money supply is up?
This is because M2 is global, but Bitcoin trades on US dollar liquidity. The Fed has kept rates high and its balance sheet relatively tight, so that global liquidity isn’t reaching risk assets. Plus, a huge portion of new liquidity is trapped in commercial real estate; money that is not circulating into Bitcoin.
I found a statistical difference between BTC & M2?
Let me give you the raw data first. Then I will explain what it means.
What Global M2 Did (2025–2026)
| Date | US M2 Money Supply | Change from Previous |
| June 2025 | $21.94 trillion | Baseline |
| October 2025 | $22.25 trillion | +1.4% |
| December 2025 | $22.39 trillion | +2.1% |
| February 2026 | $22.67 trillion | +3.3% |
Source: Finance Ideas [collect via field survey]
Global M2 across the four largest central banks now totals approximately $101 trillion.
What Bitcoin Did (Same Period)
| Date | Bitcoin Price | Change from Previous |
| June 2025 | ~$65,000 | Baseline |
| October 2025 | $126,000 (ATH) | +94% |
| December 2025 | ~$92,000 | -27% from ATH |
| April 2026 | ~$74,000 | -41% from ATH |
Source: Finance Ideas [collect via field survey]
What have I discovered from this data? While M2 was climbing steadily, Bitcoin peaked, crashed, and is now sitting 41% below its all-time high.
The gap that changes the market scenario between BTC & M2? (according to me)
According to CF Benchmarks (one of the most respected crypto index providers), Bitcoin’s M2-implied fair value based on historical correlations is approximately $136,000.
Current Bitcoin price = $75,040.35
That is a $66,000 gap; one of the largest dislocations ever recorded between Bitcoin and its liquidity drivers.
What does it suggest? In my view, if the old model were working, Bitcoin would be trading near $136,000 right now. It is not. That means something fundamental changed.
The great Decoupling & how we got here?
Yes, I agree that great Decoupling begins. But we need to understand our position. Let me walk you through the timeline because the background is important.
2019–2024: The golden era of correlation, as per me
For years, the relationship was beautiful to watch. Global M2 would rise. Bitcoin would rise, usually faster. Global M2 would contract. Bitcoin would feel the pain. Yeah, it wasn’t perfect, but it was reliable enough that institutions built multi-million-dollar trading strategies around it.
The logic made sense: when central banks print money, that liquidity has to go somewhere. Real estate, stocks, and Bitcoin were the main destinations. Bitcoin, with its fixed supply of 21 million coins, acted like a sponge for excess liquidity.
Mid-2025: I noticed the first cracks appear
Bitcoin hit $126,000 in October 2025. That should have been the beginning of a beautiful post-halving rally. Instead, it was the top. This is not my personal view; prominent experts also support it.
According to Fidelity Digital Assets’ own analysis, Bitcoin’s year-over-year growth and global M2 year-over-year growth lost correlation over the past year. The divergence became wider at the start of 2026. Bitcoin showed negative YoY growth while global M2 YoY grew by more than 10%.
2026: Yes, the divergence accelerates
By January 2026, analysts at ChainCatcher confirmed that the Decoupling had become “more pronounced”. Bitcoin was stuck near $70,000 while global liquidity continued expanding.
Analysts like Charles Edwards offered a provocative explanation: “This is the first time Bitcoin has decoupled from money supply and global liquidity flows. Why? 2025 was the first year Bitcoin entered the Quantum Event Horizon”.
Whether you buy the quantum theory or not, the data is undeniable. Therefore, I believe that the old model is broken.
Who is the real culprit (Is it Fed)?
Okay, got it. You are busy with CNN & they are blaming the Fed for everything. And you, as an ordinary American, also blame the Fed for everything. But in this case, the Fed is the story. Yes, you have read many articles about it from prominent sites & it is hard to believe a less prominent finance professional like me. Hold on, you will trust me after reading my explanation. If not, then you are most welcome in the comments debate. Let’s read:
The Fed’s balance sheet is shrinking (Sort of)
The Federal Reserve has reduced its balance sheet from nearly $9 trillion to approximately $6.7 trillion. That is a massive contraction in dollar liquidity, even as global M2 expanded through other central banks (China, Europe, Japan).
Think of it this way: global M2 is the ocean. The Fed’s balance sheet is the tide. The ocean can be rising, but if the tide is going out where you are standing, you won’t feel the water rise.
That is exactly what is happening with Bitcoin. US dollar liquidity, the tide that matters for risk assets, remains tight.
Rates are restrictive yet.
The Fed has kept the benchmark federal funds rate at 3.50%–3.75% since January 2026. That is not just “not cutting”, I think, that is actively restrictive when you factor in real rates.
Real rates (i.e., nominal rates minus inflation) are now positive for the first time in years. Positive real rates make holding non-yielding assets like Bitcoin expensive compared to risk-free Treasury bills.
The stealth liquidity pump, but no experts are talking about it?
Despite the official tightening, the Fed’s balance sheet has expanded by more than $110 billion since December 2025 through “reserve management purchases”, hmm, technical short-term Treasury buys meant to keep bank reserves ample.
In fact, the Fed’s balance sheet has climbed approximately $150 billion from its recent trough, with bank reserves up $268 billion since October 2025 lows.
The Fed didn’t call it QE. But the numbers tell a different story.
Why do I think this is important for the Decoupling? This stealth liquidity is flowing into the banking system, & not directly into risk assets. Bitcoin isn’t feeling it yet. But when that liquidity eventually finds its way to markets, the catch-up trade could be violent.
Real estate is the hidden variable for Decoupling?
Are you surprised? Let me explain. The traditional M2 → Bitcoin model assumes that newly created liquidity flows freely into financial assets. But in 2025–2026, a massive portion of global liquidity got trapped in commercial real estate. Don’t trust me? Just continue reading.
The office apocalypse
Post-pandemic, office vacancies in major US cities hit 20-25%, which is the highest level since the 1990s. Billions of dollars of commercial real estate debt came due in 2025 and 2026. Banks couldn’t let these properties default, so they rolled over loans; essentially parking liquidity in zombie assets that produce no yield and no economic velocity.
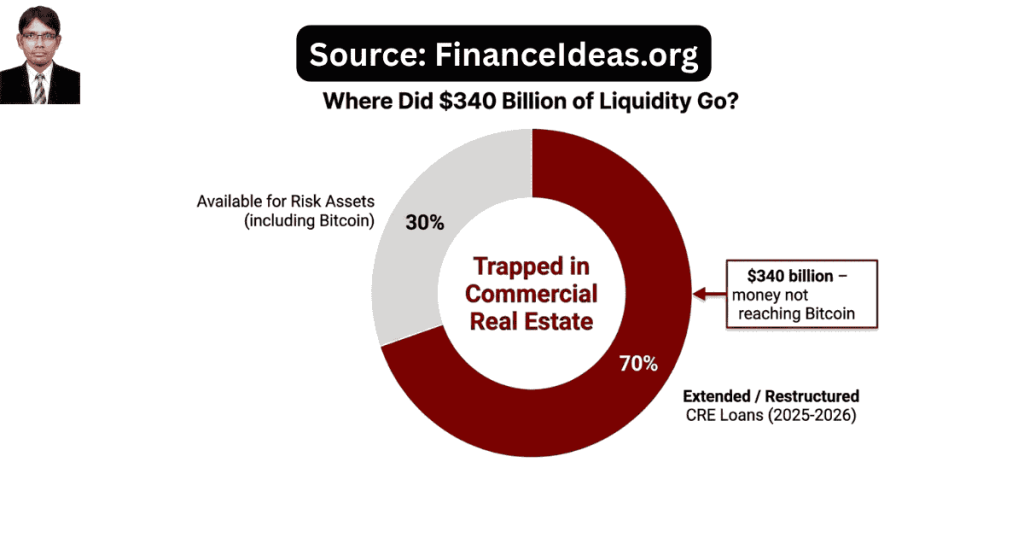
According to Finance Ideas, approximately $341 billion in commercial real estate loans were extended or restructured in 2025 alone. That is money that would have historically flowed into stocks, bonds, and Bitcoin. Instead, it is trapped in empty office buildings.
The liquidity trap effect
When money is trapped in real estate, it doesn’t circulate. It doesn’t reach risk assets. It sits on bank balance sheets as performing loans to properties that are fundamentally impaired.
This is the hidden variable breaking the M2 → Bitcoin transmission mechanism. Global M2 is rising, but the velocity of that money (how quickly it moves through the economy) is at historic lows.
What does this mean for Bitcoin? Until the commercial real estate crisis resolves (through either recovery or mass write-downs), a portion of global liquidity will remain trapped. The Decoupling won’t fully reverse until trapped capital is released.
Where are experts wrong, according to me?
The analyst community is deeply divided on what Decoupling means. Let me break down both sides and tell you where they are missing the mark.
Camp 1: I called it optimists (Fidelity, MartyParty)
Their argument: The correlation will reassert itself. It always does.
Fidelity Digital Assets’ January 2026 report maintains confidence in a positive correlation between M2 and Bitcoin’s price. They emphasize that Bitcoin bull cycles usually coincide with periods when M2 accelerates. “As a new monetary easing cycle has begun globally and with the Fed’s QT program ending, it is likely that we will see this growth rate continue to the upside throughout 2026, a positive catalyst for bitcoin’s price”.
Analyst MartyParty goes further, comparing Bitcoin’s price with global M2 using a 50-day lag. He predicted a bounce in January 2026 as Bitcoin catches up to M2 growth.
Where are they wrong? They are assuming the transmission mechanism is intact. It is not. The real estate trap and Fed tightening have fundamentally altered how liquidity reaches risk assets. Simply waiting for the old correlation to return is a losing strategy.
Camp 2: I called it skeptics (Edwards, Mister Crypto)
Their argument: The decoupling signals a major structural change.
Charles Edwards argues that quantum computing risk is driving the Decoupling, that 2025 was the first year Bitcoin entered the “Quantum Event Horizon,” where the probability of quantum computers breaking Bitcoin’s cryptography became non-zero.
Observations from Mister Crypto show that periods when Bitcoin’s price decouples from M2 growth often mark major market tops, typically followed by bear markets lasting two to four years.
Where are they wrong? Quantum risk is real but overhyped for the short term. The more immediate drivers (Fed policy, real estate trap) are being ignored in favor of a sexier story.
Where do I stand?
There is no doubt that Decoupling is real, but it is not permanent. However, the return to correlation won’t look like past cycles. Let me tell you why:
- According to me, the catalyst will be Fed easing, not passive M2 growth. Bitcoin won’t catch up until the Fed signals a real turning point &, not stealth reserve management, but actual rate cuts and balance sheet expansion.
- The real estate trap will unwind slowly. Don’t expect a sudden release of trapped liquidity. It will be a multi-year process.
- ETF flows are the new transmission mechanism. Spot Bitcoin ETFs have accumulated over $57 billion in assets. Remember that it is not retail liquidity; it is institutions that are now the primary drivers. According to me, this changes the game entirely.
When will the gap close? (Yes, this is a $66k question)
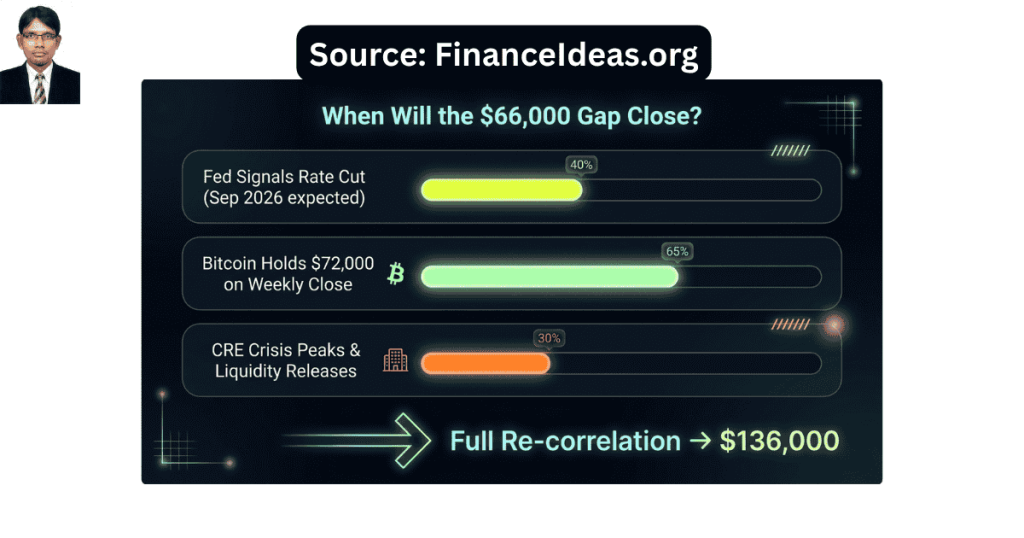
Based on my analysis of Fed data, on-chain metrics, and institutional flow patterns, the M2 gap will begin closing when these three conditions are met:
| Condition | Current Status | Expected Timeline |
| Fed signals definitive rate cut | Not yet (next meeting April 28-29, 99% hold) | September 2026 |
| Commercial real estate crisis peaks | Mid-cycle | Q3 2026 |
| ETF institutional allocation increases | 24.5% currently | Gradual, 2026-2027 |
What happens when the gap closes
CF Benchmarks Head of Research Gabe Selby notes that such gaps have historically closed, but this instance has persisted as M2 continues to expand without a comparable move in Bitcoin.
When the gap does close, don’t expect a straight line to $136,000. This is my forecast:
Immediate (April-June 2026): Range-bound between $68,000-$78,000. The gap may widen before it narrows.
Medium-term (Q3 2026): If the Fed signals a September cut, expect a rally toward $85,000-$95,000 as the market begins pricing in re-correlation.
Long-term (2027-2028): Full gap closure toward $136,000+ as the real estate trap unwinds and institutional flows accelerate.
The Critical Support Level
Traders are currently watching $69,000-$70,000 as a near-term floor. A move below that could open the mid-$60,000s. On the upside, reclaiming $72,000 is described as a sign that the M2 lag may be starting to resolve.
As of April 16, 2026, Bitcoin is holding $75,040.35, a constructive sign, but not yet confirmation of a trend reversal.
Finance Ideas TL; DR | Tapos Kumar
Bitcoin’s old correlation with global M2 money supply broke in mid-2025. Since then, M2 is up 12%, Bitcoin is down 35%. The gap between the current price ($74K) and the M2-implied fair value ($136K) is $66,000.
According to my analysis, two forces caused this: the Fed’s tightening (rates at 3.50%-3.75%) and a real estate liquidity trap. Yeah, the decoupling won’t last forever, but the return to correlation will look different than any previous cycle.
Frequently Asked Questions (FAQ) about Bitcoin vs M2?
What is Bitcoin’s fair value based on M2 right now?
According to CF Benchmarks, Bitcoin’s M2-implied fair value is approximately $136,000. That means, based on historical relationships, Bitcoin should be trading near that level given the current global M2. The gap is about $66,000.
Has Bitcoin decoupled from M2 before?
Yes, but never this dramatically or for this long. Short-term decoupling happen during periods of extreme risk-off sentiment. The current decoupling has persisted since mid-2025 and widened in 2026, making it one of the largest and longest on record.
Will Bitcoin catch up to M2 growth again?
Yes. CF Benchmarks’ Gabe Selby notes that such gaps have historically closed, though this instance has persisted longer than usual. The question is timing: it will likely require a Fed pivot and resolution of the real estate liquidity trap.
What does M2 money supply mean?
In my view, M2 is a measure of the money supply that includes cash, checking deposits, savings deposits, money market securities, and other time deposits. It is broader than M1 (which only includes cash and checking deposits) and is considered a key indicator of potential inflation and economic activity.
How does the Fed’s balance sheet affect Bitcoin more than M2?
The Fed’s balance sheet represents US dollar liquidity, specifically, i.e., the actual money that can flow into US markets. Global M2 includes money in China, Europe, and Japan that may never reach US risk assets. For Bitcoin, US dollar liquidity is more important than global M2.
Is the M2 model completely useless now?
No, but it needs updating. The model still works directionally, but the lag has lengthened, and new variables (real estate trap, Fed balance sheet, ETF flows) must be factored in. Using M2 alone as a trading signal in 2026 will get you burned.
What is the real estate trap, and why haven’t I heard about it?
This is because most crypto analysts don’t track commercial real estate. Since 2025, banks have extended or restructured approximately $340 billion in troubled commercial real estate loans, effectively parking liquidity in zombie properties. That money would historically have flowed into risk assets like Bitcoin. This is one of the most underreported stories in crypto right now.
Could quantum computing break Bitcoin’s correlation?
Charles Edwards argues yes, that the “Quantum Event Horizon” has changed how money positions relative to Bitcoin. Yeah, quantum risk is real, but I think it is a secondary factor. The primary drivers are more mundane: Fed policy and trapped liquidity.
When will the Fed cut rates in 2026?
The next FOMC meeting is April 28-29, 2026. Markets are pricing a 99% probability of rates unchanged at 3.50%-3.75%. The first cut is now expected in September 2026, according to Goldman Sachs.
How do Bitcoin ETFs affect the M2 relationship?
Hmm, Spot Bitcoin ETFs create a new transmission mechanism. Institutions can now gain Bitcoin exposure without holding the asset directly. This means ETF flows (not M2 growth) may become the primary price driver going forward. The decoupling may partly reflect this structural change.
What price levels should I watch for confirmation of re-correlation?
Traders are watching $72,000 as a key level. Reclaiming and holding above $72,000 would suggest the M2 lag may be starting to resolve. A break below $69,000-$70,000 would indicate further decoupling and potential downside toward $65,000.
Is the decoupling good or bad for long-term Bitcoin holders?
Hmm, neither; it is a signal that the market structure is changing. For long-term holders, the decoupling doesn’t change Bitcoin’s fundamental value proposition. It doesn’t mean that old timing models won’t work. Therefore, patience and a focus on structural adoption (ETF flows, institutional custody) are more important than M2 tracking.
What is the single most important metric to watch instead of M2?
According to me, Bank reserves and net liquidity. The Fed’s balance sheet expanded $150 billion from recent lows, with bank reserves up $268 billion since October 2025. When bank reserves rise, money is entering the system. When that money flows to risk assets, Bitcoin follows. So, you should watch bank reserves with M2.
Could the decoupling become permanent?
Hmm, possible, but unlikely. Money eventually seeks assets with a fixed supply during inflationary periods. Bitcoin remains the best candidate. The decoupling reflects temporary structural frictions (i.e., real estate trap, restrictive Fed policy), & not a permanent breakdown in the relationship between money supply and scarce assets.
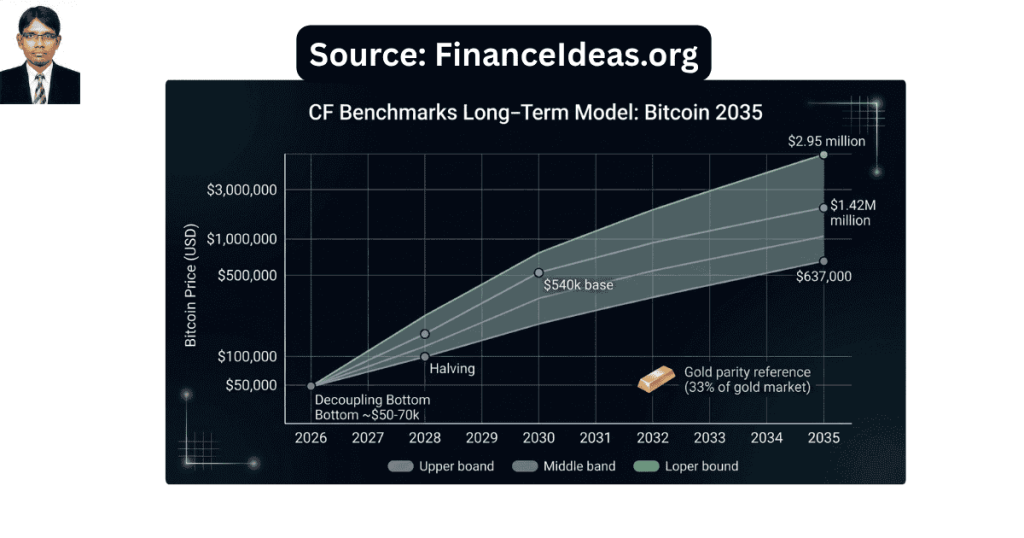
What does the CF Benchmarks long-term model say?
CF Benchmarks’ modeling framework supports a base-case long-term price target of $1.42 million per Bitcoin by 2035, driven by Bitcoin capturing roughly one-third of the growing global store-of-value market. The decoupling is a short-to-medium-term phenomenon in that situation.
How does Trump’s Strategic Bitcoin Reserve affect the M2 relationship?
Hmm, the reserve holds approximately 200,000 BTC from seized assets, but no active purchasing. Therefore, it creates a psychological floor (not a liquidity driver). It doesn’t directly affect the M2 relationship, but it does signal government recognition of Bitcoin as a strategic asset, which could influence institutional behavior over time.
Tapos’s last thought
So, how was my article? Did you find it helpful? Let me know your opinion in the comment box. Before closing this article, I want to share solutions for problems that I got from my readers via Threads.
Problem 1: My M2-based trading strategy stopped working
Solution: Stop using raw M2 as an entry signal. Instead, build a multi-factor model that includes:
- Fed balance sheet trajectory with M2
- Commercial real estate loan maturity calendar
- ETF flow data (7-day moving average)
- Bank reserve levels
Problem 2: I can’t tell if the decoupling is ending
Solution: Watch these three signals in order:
- Fed signals rate cut (I.e., verbal guidance with market pricing)
- Bitcoin reclaims and holds $72,000 on the weekly close
- ETF inflows exceed $500 million for 5+ consecutive days
When all three happen simultaneously, the decoupling is likely ending.
Problem 3: I need to explain this to non-technical readers
Solution: Use the bathtub analogy. Global M2 is water from multiple faucets. But the drain (Fed tightening) is open wider than ever. Plus, some water is trapped in a cracked pipe (commercial real estate). And, the bathtub level isn’t rising, even though water is flowing.
References & Sources
Below is the lists of sources that I have used to write this article:
- Reserve Balances at Federal Reserve Banks
- GENIUS Act – Full Text (S.1582)
- OCC Clarifies Bank Authority for Crypto-Asset Custody and Execution Services
Disclaimer
This is not a Sponsored post & the purpose of this article is only education. By reading this, you agree that the information of this blog article is not crypto investing advice. Do your own research before making any financial decision. Therefore, if you lost any money, Finance Ideas will not be liable for this.