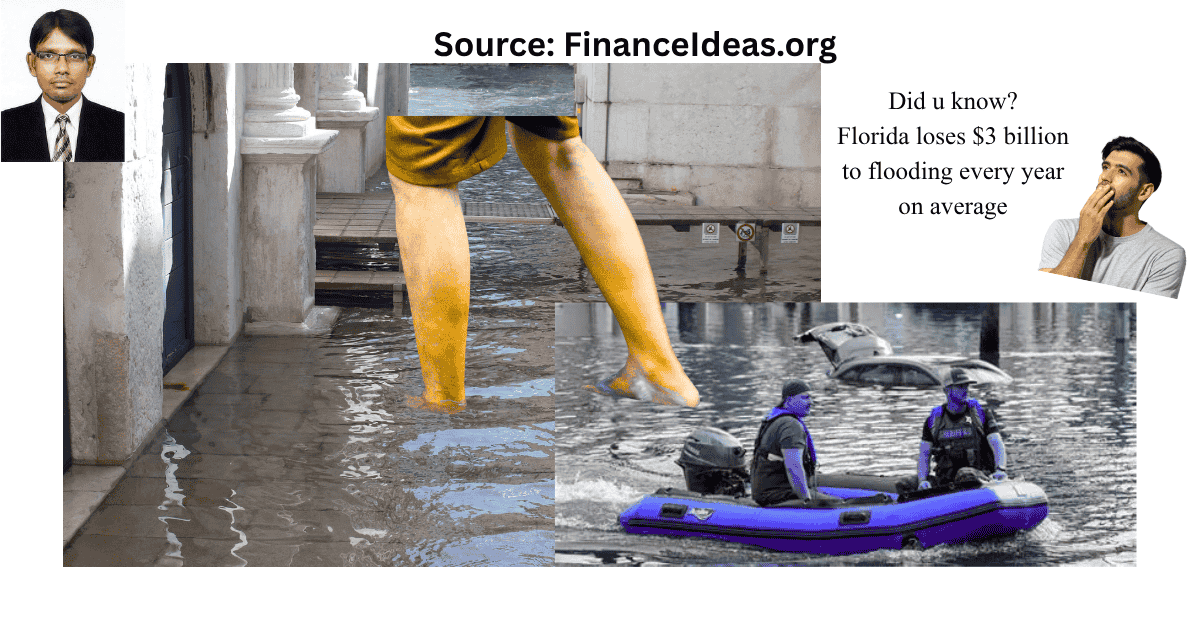
Yes, I have written 18% & that is Florida’s share of every single active National Flood Insurance Program policy in America. $2.98 billion; that is what flooding costs Florida every single year, on average. 9.87 million: that is how many Floridians live in flood‑risked areas. Then, $44.8 billion; that is what storm events have cost the state over the past decade.
I know I have written “that is” many times, and it can feel boring. However, this is the reality of living in Florida today. According to our study, Florida loses about $3 billion to flooding per year. Every year, about 10 million Floridians, hmm, roughly half the state’s population, live in areas that could flood.
Look, I am not a policymaker, so I will not use bureaucratic language. Last night, I thought of closing my content cluster about Florida flood insurance. Then I revisited FEMA, NOAA, the Florida Office of Insurance Regulation, and the US Census Bureau. Here, I had discovered a gap & that is Flood damage statistics.
Yeah, I visited major US news sites, prominent insurance & finance sites, and even local sites that cover national issues. Unfortunately, I didn’t find anything helpful for flood victims in Florida.
Let me be clear: I am not ignoring anyone to prove I am a genius. I just talked about the facts & the reality is: nobody cares about flood victims.
Considering the above concerns, Finance Ideas has decided to write a data-based article so you understand flood damage & make proper decisions. But I beg you one thing: I write on issues, i.e., problems to solutions; so, take some extra time to understand this article. Let’s start:
Finance Ideas AI snippet box | Tapos Kumar
How many Floridians will be affected by coastal flooding by 2050?
Our forecast is: By 2050, an estimated 23,000 people and 17,000 homes in Florida will experience annual coastal flooding. Florida leads the nation in this category, more than New York, New Jersey, and Louisiana.
In Miami‑Dade alone, under current emission targets, 2,500 residents and 1,700 homes will face annual coastal flooding. Under unchecked emissions, that jumps to 3,200 people and 2,200 homes. And these projections don’t account for rainy‑day flooding or the effects of stronger, more destructive hurricanes and their storm surges. For these reasons, I think the reality will likely be much worse.
Related articles
- The ABCs of Flood Insurance in Florida
-
Florida landlord flood disclosure: How One Florida Landlord Lost $30k
-
Increased cost compliance Florida: The $30,000 Hidden Benefit
-
Cobra zone flood insurance Florida: When Your Florida Home Can’t Get Federal Flood Insurance
-
Renters flood insurance Florida: Your Landlord’s Policy Won’t Save You
I found Florida ranked number 1 in America for flooding (Yeah, based on federal data)?
Our study found that Florida accounts for 18.4% of all US flood losses. I don’t think it is just a statistic; in my view, it is a reality that affects 10 million Floridians, 1.8 million flood insurance policies, and $1.1 trillion in property value.
Therefore, when it comes to flood damage, Florida stands alone at the top. Don’t trust me? Okay, first read the table.
| Metric | Florida’s rank | The number |
| Total flood damage | #1 nationally | $1.11 billion, hmm, 18.4% of all U.S. flood losses |
| Flood damage density | #2 nationally | $20,737 per square mile |
| NFIP policyholders | #1 nationally | 1.8 million, hmm,18% of all active NFIP policies |
| Expected annual flood loss | #1 nationally | $2.98 billion per year |
| Population in flood zones | #1 nationally | 9.87 million residents |
Now tell me, do you trust me? Let me know in the comments.
What flood insurance paid (I am talking about NFIP)?
The National Flood Insurance Program has shouldered the largest financial burden from Florida’s recent hurricanes.
Yes, this is true. Can we expect lower rates in the future? I don’t think so until necessary steps are taken. Let me back my opinion:
Hurricanes Helene and Milton?
I have explained the combined impact here. Look, I base all my metrics on federal data. If you doubt me, then pause for a second & visit federal sites. Anyway, let’s read the table:
| Metric | Number |
| Total NFIP claims paid | $7.5 billion |
| Total families helped | Over 76,000 |
| Helene claims | $6.3 billion for 54,622 claims |
| Milton claims | $1.2 billion for 21,468 claims |
| FEMA assistance for uninsured losses | $1.7 billion |
| Total FEMA recovery support | $11 billion+ (grants, reimbursements, and flood insurance) |
NFIP policyholder statistics?
Now I will disclose policyholder stat here. It will give you more clear reality about policyholders.
| Metric | Number |
| Total NFIP policies in Florida | 1.8 million; 18% of all active NFIP policies nationwide |
| Florida’s share of NFIP policies | 18% |
| National average loss (NFIP Florida) | $1.1 billion annually |
| Policy growth since Risk Rating 2.0 | Nearly 100,000 new policies; 6% growth |
My personal observation: The NFIP has paid $7.5 billion to 76,000 Florida families after two storms. Um, that is more than the annual budgets of some small states. And it is only a fraction of the total flood risk Florida faces every year.
Expected future cost for annual flood loss in Florida (my forecast based on FEMA)?
Aha! I will not speak like a bureaucrat here. So, you will get the exact numbers federal agencies reported. FEMA’s National Risk Index estimates the long-term average annual cost of flooding in Florida. You can check their official site if you have doubts. In the table below, I have included their estimate. Let’s understand them:
| Flood type | Expected annual loss |
| Inland flooding (rivers, creeks, rainfall) | $2.78 billion per year |
| Coastal flooding | $201.4 million per year |
| Combined expected annual loss | $2.98 billion per year |
My forecast based on these data: Every year, Florida can expect an average of nearly $3 billion in flood damage (perhaps I mentioned this figure many times). Some years will be worse. Some will be better. But over time, the cost is staggering.
Mark my words: Florida loses $3 billion to flooding every year, on average. That is before you factor in the catastrophic years like 2022 (Hurricane Ian) or 2024 (Helene and Milton). The baseline cost of flooding in Florida is a $3 billion annual tax on the state’s economy.
Who is affected by flooding in Florida?
“I didn’t know it was going to rain!” –I recall Moonee from “The Florida Project (2017)”.
In my view, Moonee perfectly explained the unpredictability of Florida’s weather & flooding. Her statement also symbolizes how unprepared communities can be when disaster strikes. When I watched this movie, I asked myself: What happened to Moonee after The Florida Project? Anyway, my emotional curiosity forced me to ask such questions.
Now listen, beauty is found within Florida. Do you know how you & your property can be affected by flooding? Let me know in the comments. Meanwhile, I will explain it in two parts: population & property. I am explaining it in 2 parts because my study found a twofold impact.
Population at risk for flooding?
Flooding doesn’t just damage property; it also affects people. In Florida, nearly 10 million residents live in flood-risk areas. Let’s read the data:
| Population group | Number |
| Inland flood-risked residents | 3.97 million |
| Coastal flood-risked residents | 5.90 million |
| Total flood-risked residents | 9.87 million (nearly 10 million) |
| Seniors at risk from coastal flooding | 143,000+ (highest in the nation) |
| Residents projected at risk by 2050 (severe coastal flood) | 505,000 |
Property value at risk?
Flooding negatively impacts your property also. And, the below data will surprise you.
| Metric | Range |
| Property value risk to flooding | $1.1 trillion – $1.93 trillion |
| Percentage of all Florida property value | 25% – 43% |
| Storm surge risk (replacement cost value) | $747.6 billion, hmm, 3x more than Louisiana |
What I found: Nearly 10 million Floridians, hmm, roughly half the state’s population, live in flood-risked areas. And up to 43% of all property value in Florida is at risk. When the water rises, it doesn’t just destroy homes; it also destroys livelihoods.
County-level flood risk in Florida?
I am surprised to see the data. I found the damage is worst at the county level. Yes, this is true & I am talking from FEMA data. FEMA’s National Risk Index provides county-level data on expected annual flood losses. Here are the counties with the highest risk:
| County | Expected annual flood loss |
| Broward County | $648.0 million |
| Miami-Dade County | About $378.6 million |
| Duval County | $263.9 million |
| Palm Beach County | $186.4 million (estimated) |
| Orange County | $181.8 million (estimated) |
| Hillsborough County | $154.2 million (estimated) |
| Okaloosa County | $134.5 million |
| Seminole County | $129.2 million |
| Monroe County | $93.3 million |
Note: These figures are based on FEMA’s National Risk Index. I found some counties show higher numbers in specific flood risk categories. Miami-Dade County, for example, has an estimated annual loss from inland flooding alone of over $355.8 million.
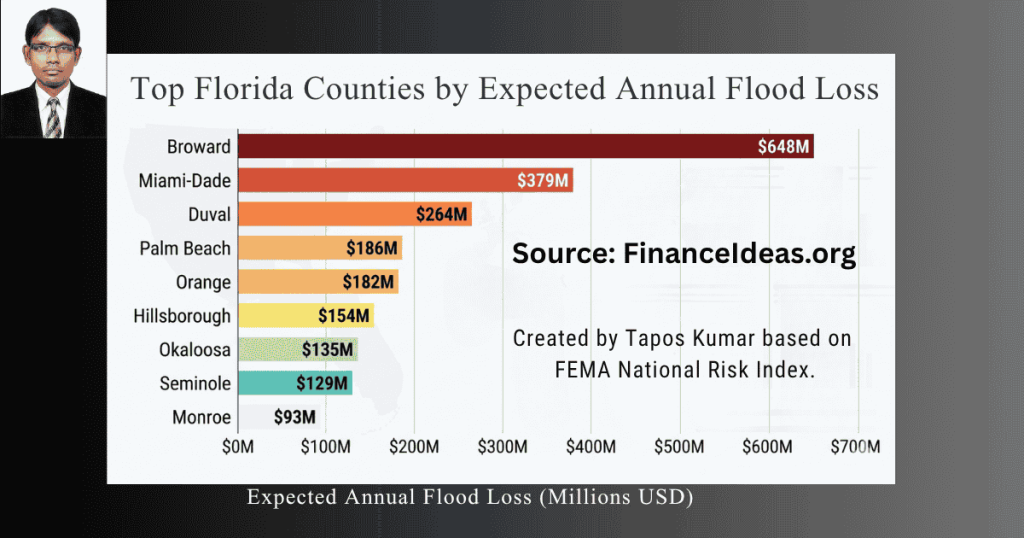
Mark my words: Broward County alone faces $648 million in expected annual flood losses. Miami-Dade is close behind at $378 million.
Point to be noted: These aren’t one-time disaster costs; they are the annual baseline cost of doing business in coastal Florida.
I have collected 10 years storm data?
Now it is 2 am & I am checking historical context about storms. Everyone is sleeping, but I & my laptop are working. Yeah, I just took black coffee for a headache.
Anyway, come to the point. NOAA’s Storm Events Database provides a decade of storm data for Florida. This isn’t my personal, observation-based data; I’m just citing NOAA’s data. So, you can trust me. Let’s read:
| Metric | Number |
| Storm events (2015-2025) | 13,786 |
| Total property damage | $41.8 billion |
| Total crop damage | $3.0 billion |
| Total combined damage | $44.8 billion |
| Fatalities | 642 |
| Injuries | 692 |
Recent Hurricane costs
I have also analyzed recent cost so that you can understand future consequences. Let’s read the table:
| Hurricane | Insured losses | Total Economic cost |
| Hurricane Milton | $4.27 billion | $34.3 billion |
| Hurricane Helene | $2.39 billion | Included in $34.3B+ |
My neutral analysis: Over the past decade, Florida has experienced 13,786 storm events, causing $44.8 billion in damage and 642 fatalities. I don’t think that is a disaster trend; I think it is a disaster reality. And it is getting worse.
Finance Ideas TL; DR | Tapos Kumar
Florida’s flood crisis is measured in billions. Our study found the following data that could surprise you:
The big picture:
$1.11 billion = Total flood damage in Florida (2021-2025), number 1 in the nation
$20,737 per square mile = Flood damage density, number 2 nationally
$2.98 billion per year = Expected annual flood loss across the state
$44.8 billion = Total storm damage (2015-2025) from 13,786 events
The NFIP numbers:
$7.5 billion = Paid to over 76,000 families after Helene and Milton
$6.3 billion = For 54,622 Helene claims
$1.2 billion = For 21,468 Milton claims
1.8 million = Active NFIP policies in Florida, hmm, 18% of the national total
The human cost:
9.87 million = Floridians living in flood-risked areas (3.97M inland + 5.90M coastal)
642 = Fatalities from storm events in Florida (2015-2025)
$1.1T to $1.93T = Property value at risk to flooding; 25% to 43% of all Florida property value
Frequently Asked Questions (FAQ) about Florida flood statistics?
Florida ranks number 1 in total flood damage. But what does the damage density ranking tell us that total damage doesn’t?
Hmm, total damage tells you the scale. Damage density tells you the concentration. Florida ranks number 2 nationally for flood damage density at $20,737 per square mile, trailing only New Jersey at $31,751.
But it combines the number 1 total damage ($1.11 billion) with top‑tier density. No other state matches that combination of scale and concentration. New Jersey has higher density but only $234 million in total losses. Florida has both, meaning flooding isn’t just widespread; it is hitting the most valuable real estate in the most concentrated way possible. According to me, that is a risk profile no other state faces.
How does Florida’s flood damage compare to other states in the Southeast?
I think Florida absolutely dominates the Southeast. It contributed 70.8% of the entire region’s $1.57 billion in flood losses from 2021 to 2025. Its $1.11 billion in losses is roughly 2.4 times the combined total of the nine other Southeast states. And its damage density of $20,737 per square mile runs nearly 4.6 times higher than North Carolina, the region’s next closest at $4,468. By every measure, Florida doesn’t only lead the Southeast in flood vulnerability; in my view, it dwarfs it.
Florida has 1.8 million flood insurance policies. Is that enough?
Ah, not even close. While Florida leads the nation with 1.8 million NFIP policies, 18% of the national total, the coverage is wildly uneven. Along the coasts, nearly 20% of homes have flood insurance. But in Central Florida, it drops to just 6%.
In Lake County, it is about 3%. This despite the fact that all 67 Florida counties are prone to flooding. In the past five years alone, four major hurricanes have caused more than $60 billion in damage, with severe impacts in Orlando and surrounding communities. The idea that you only need flood insurance on the coast is a myth, and it is leaving millions of Floridians at risk.
What is the real dollar risk Florida faces from flooding?
Um, A 2025 Florida Legislature report found that between $1.1 trillion and $1.93 trillion in property value across the state could be at risk from flooding; roughly 25% to 43% of all property value in Florida. The High Impact Zone, largely coastal areas, contains about $1.86 trillion in property value. And about $1 trillion of that consists of structures built before 2002, when Florida adopted stronger building codes following a series of devastating hurricanes. We are sitting on a trillion dollars of pre-code coastal property that is one storm away from disaster.
Which Florida counties have more than 90% of their property value in high‑impact flood zones?
Um, several coastal counties including Monroe, Collier, Franklin, Charlotte, and Lee have more than 90% of their property value located in high‑impact flood zones, largely due to their coastal geography and low elevation.
The point is: These aren’t just at-risk properties; they are entire local economies built on increasingly vulnerable land. Residential housing represents about 78% of property value in the highest‑risk areas.
Look, when you are talking about counties where 9 out of every 10 dollars of property value sits in a high‑impact flood zone, you are not talking about individual homeowners; instead, you are talking about systemic economic risk.
Is Florida keeping up with flood insurance demand as the state grows?
No, and the gap is widening. Let me back my view. In 2017, Florida had under 2 million flood insurance policies. Last year, there were about 2.1 million policies, um, a modest increase. But during that same period, Florida added more than 700,000 homes. The state is growing, but flood insurance coverage is not keeping pace. This is partly because homeowners are financially tapped out from soaring premiums, which have spiked by nearly 30% over the last five years.
What is the significance of Florida’s 2002 building code changes for flood risk?
Florida adopted stronger building codes following a series of devastating hurricanes in the late 1990s and early 2000s.
But the problem is: about $1 trillion of the property value in Florida’s high‑impact flood zones was built before those codes took effect. That means about $1 trillion of coastal property was built to older, less resilient standards. These structures are more vulnerable to flood damage, more expensive to repair, and more likely to be declared substantially damaged after a storm. Therefore, I think the combination of pre‑code construction and rising sea levels is a ticking time bomb.
Why are so many flood claims being denied in Florida?
The Florida Office of Insurance Regulation has launched a public‑facing website to provide updated data on hurricane insurance claim denials. I will answer this question based on this data. The data shows that most denials aren’t due to insurer misconduct; they are due to homeowners not understanding what their policies cover. The most common reasons I found were damage falling below deductibles and flood exclusions homeowners didn’t know existed. It is not that insurers are being unfair; it is that homeowners are walking into hurricane season with coverage gaps they don’t know exist.
How vulnerable is Florida to NFIP lapses?
Aha! Extremely vulnerable. Let me tell you why. Florida has 1.8 million NFIP policyholders; 18% of all active policies nationwide. When the NFIP lapses, new policies can’t be issued, and renewals can’t be processed. The National Association of Realtors estimates that 1,300 home sales nationwide could be disrupted each day if the NFIP lapses.
In Florida, over 25,000 real estate closings with a mortgage require flood insurance each month. A single lapse could freeze a massive portion of Florida’s real estate market overnight.
Why don’t more Floridians have flood insurance?
I found 2 reasons: cost and misconception. Homeowner insurance premiums have spiked by nearly 30% over the last five years, leaving many families financially tapped out. When you are already paying thousands more for wind coverage, adding flood insurance feels like one expense too many.
But the bigger problem is misconception. After analyzing the issue, I found: Many Floridians, especially in Central Florida, don’t think they are at high risk for flooding because they are not on the coast. Yet all 67 Florida counties are prone to flooding. I think the belief that it won’t happen here is the most expensive insurance mistake Floridians are making.
What is the difference between flood insurance claims and FEMA assistance?
Um, flood insurance claims are payouts from your policy, i.e., no repayment required. FEMA assistance is limited (averaging $3,000–$6,000) and comes as a loan. The NFIP has paid $7.5 billion in claims after Helene and Milton.
Tapos’s last thought
Flooding in Florida isn’t a question of ‘if’; in my view (after analysis), it is a question of ‘when’ and ‘how much.’ The data tells us exactly how much, i.e., just recheck the figure: $3 billion flooding loss every year. Therefore, the question should be: what are we going to do about it?
Hey! How was our article? This is the first data-based research article of Finance Ideas. If you think this article gives you a new perspective or you found something helpful, share this data. Share it with your readers, your viewers, your policymakers. It will inspire us to write the next data-based article for you. Goodbye!
References & Sources
Below is the lists of sources that I have used to write this article:
Disclaimer
The information provided in this article is author’s view & only for educational purposes. This is not a promotional post. By reading this, you agree that the information is not purchasing advice for flood insurance in Florida. Do your research before making any important financial decision. Therefore, Finance Ideas will not be liable for your financial loss.